ab16500 AIF1/IBA1 Antibody

Western blot analysis of extracts from 293, using AIF1 Antibody. Lane 1 was treated with the antigen-specific peptide.
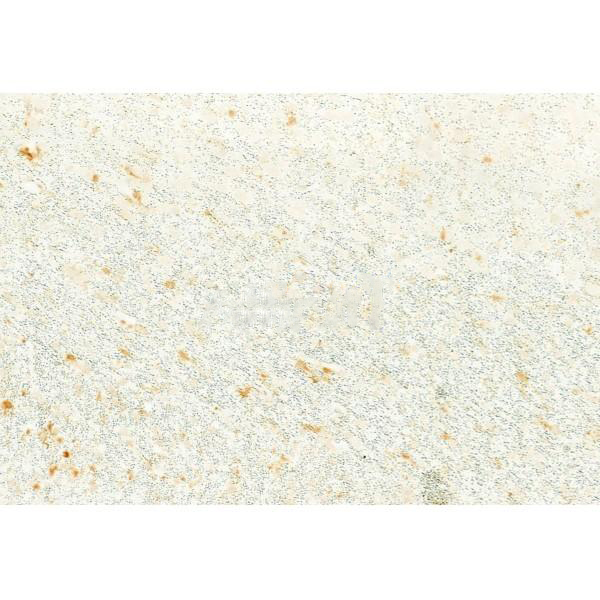
ab16500 at 1/100 staining Rat brain tissue by IHC-P. The sample was formaldehyde fixed and a heat mediated antigen retrieval step in citrate buffer was performed. The sample was then blocked and incubated with the primary antibody at 4°C overnight. An HRP conjugated anti-Rabbit antibody was used as the secondary antibody.
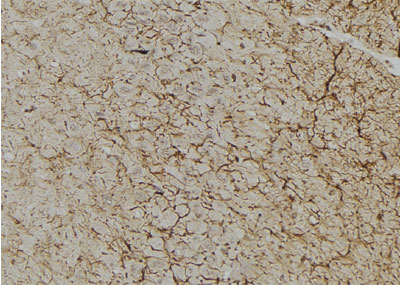
ab16500 at 1/100 staining rat brain tissue by IHC-P. The sample was formaldehyde fixed and a heat mediated antigen retrieval step in citrate buffer was performed. The sample was then blocked and incubated with the antibody for 1.5 hours at 22°C. An HRP conjugated goat anti-rabbit antibody was used as the secondary antibody.
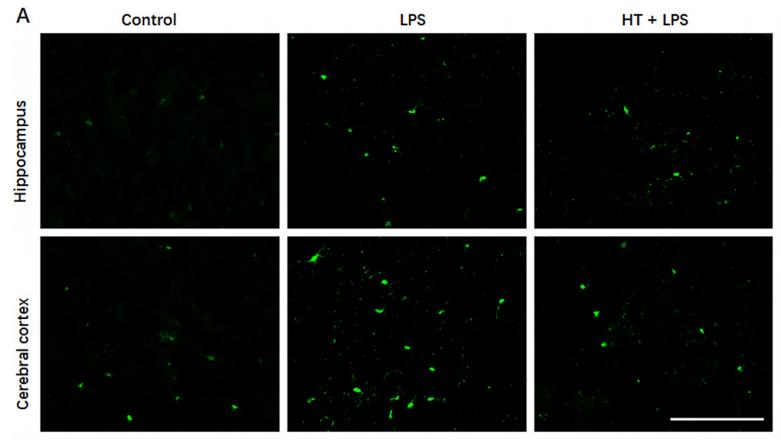
Fig11. |Effects of HT on microglia and astrocyte activation in LPS-challenged mouse brain. C57BL/6 mice were pretreated with HT (100 mg/kg) by gavage daily for 2 days, followed by injection with LPS (10 mg/kg) or PBS. 24 h after LPS or PBS injection, brain section (5 lm thick) were prepared and immunostaining for Iba-1 and GFAP were performed. Representative images of labeling for Iba-1 ((A), hippocampus and cerebral cortex) and GFAP ((C), hippocampus and corpus callosum) are presented, along with quantification results of Iba-1 (B) and GFAP (D).
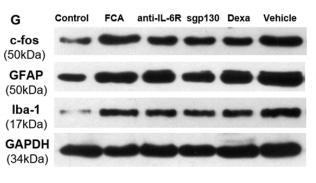
Fig. 5. |Role of anti-IL-6R, sgp130, and Dexamethasone in activated neurons, astrocytes, and microglia in the dorsal horn of FCA-treated rats vs. controls.G–J: Similar changes were noted in the expression of c-fos, GFAP, and Iba-1 proteins in the spinal cord (P < 0.05). *represents significant changes as compared to the control group. #represents significant changes as compared to the FCA group; bar = 40 μm.
Fig. 5. |Role of anti-IL-6R, sgp130, and Dexamethasone in activated neurons, astrocytes, and microglia in the dorsal horn of FCA-treated rats vs. controls.A–F: The number of activated neurons, astrocytes, and microglia cells expressed by c-fos, GFAP, Iba-1 in the spinal dorsal horn was significantly enhanced in those rats receiving FCA intraplantar injection (P < 0.05), which were significantly decreased with anti-IL-6R, sgp130, and Dexa treatment (P < 0.05).
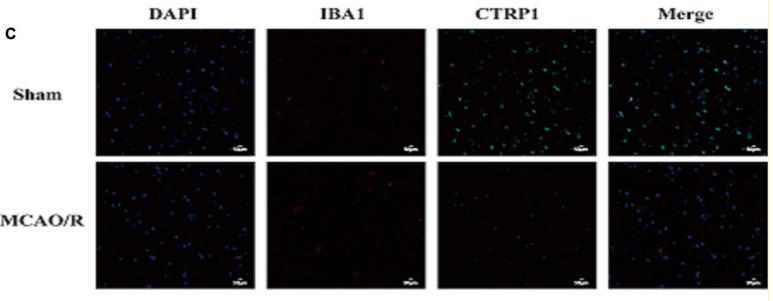
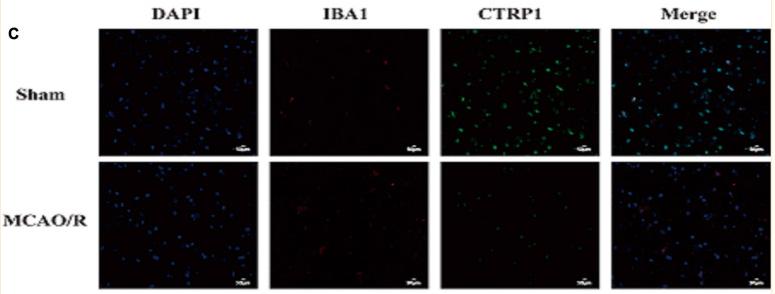
FIGURE 2 The location and expression of CTRP1 in the brain analyzed by immunofluorescence (n = 3). (A) The expression of CTRP1 in neuron in the cortex, NeuN was used to label neuron. CTRP1 expression was observed by fluorescence microscope and is shown by green fluorescence. NeuN expression is shown by red fluorescence. The nuclei were stained with DAPI and is shown by blue fluorescence. (B) The expression of CTRP1 in astroglia in the cortex. GFAP was used to label astroglia. CTRP1 expression is shown by red fluorescence. GFAP expression is shown by green fluorescence. (C) The expression of CTRP1 in microglia in the cortex. IBA1 was used to label microglia. CTRP1 expression is shown by green fluorescence. IBA1 expression is shown by red fluorescence. (D) The intensity of CTRP1 and NeuN in the cortex. The representative images were acquired under × 400 magnification, scale bars = 50 μm. ****p < 0.0001 vs. sham group.
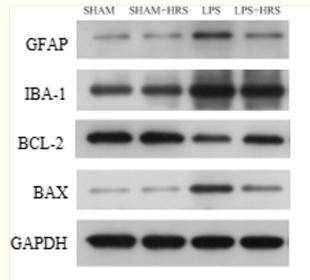
Fig. 8 Effects of HRS treatment on protein expressions in septic rats 48 h after LPS challenge. A Representative images of protein expression levels by western blot analysis in each group. B–E Statistical representation of relative protein expressions of GFAP, IBA-1, BCL-2 and BAX; respectively. All data are presented as mean ± SD ****p < 0.0001, ***p < 0.001, **p < 0.005, *p < 0.05. HRS Hydrogen-rich saline, LPS Lipopolysaccharide, GFAP Glial fibrillary acidic protein, IBA-1 Ionised calcium binding adaptor molecule 1, BCL-2 B-cell lymphoma 2
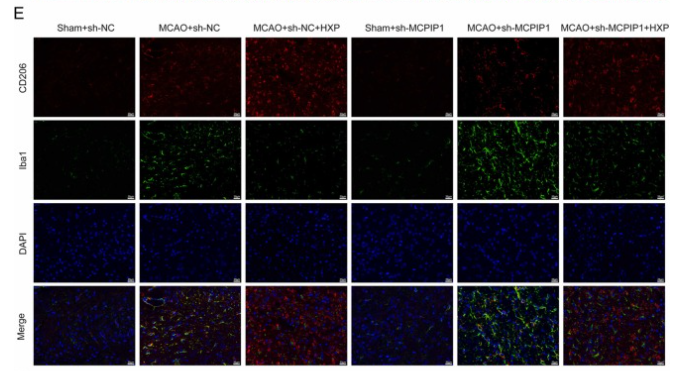
Fig. 3. HXP reduced neuroinflammation in MCAO rats by promoting MCPIP1-mediated microglia M2 polarization. A. After reperfusion for 7 d, brain water contents were examined. B. Brain infract volume was detected by 2,3,5-Triphentltetrazolium chloride staining. C. Changes in IL-1β, IL-6, iNOS, and TNF-α were measured via ELISA assy. D. Representative images of histopathological analysis. Scale bar, 20 µm. E. Representative immunofluorescence staining for CD206 (red) and Iba1 (green) in brain tissues. Scale bar, 20 µm. F. The expression of MCPIP1, CD16, iNOS, CD206, Arg1, and PPARγ was detected using Western blotting assay. Data are represented as mean ± standard deviation (N = 5). * * P 
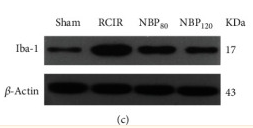
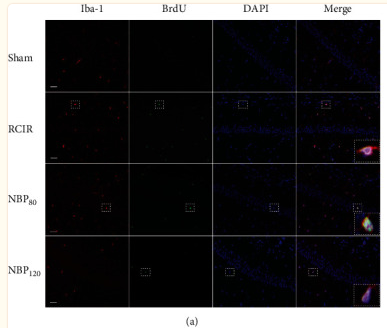
Figure 4 NBP suppressed the activation and regeneration of microglial cells after RCIR. (a) Representative images of double immunofluorescence labeling of Iba-1 (red) and BrdU (green) (200×) in CA1 regions of the hippocampus 4 weeks after RCIR. Iba1+/BrdU+ cells represented microglial proliferation. Bar = 50 μm. Typical double-labeled areas were magnified. n = 4 in each group. (b) The number of Iba-1+/BrdU+ cells in hippocampal CA1 regions. (c, d) Western blot and quantitative analysis of the expressions of Iba-1. n = 6 in each group. β-Actin was used as an internal control. ∗∗∗P < 0.001, the RCIR group vs. sham group; #P < 0.05, ###P < 0.001, the NBP80 group or the NBP120 group vs. the RCIR group; $P < 0.05, the NBP80 group vs. NBP120 group. Values are expressed as the mean ± SD. Iba-1: ionized calcium-binding adapter molecule.
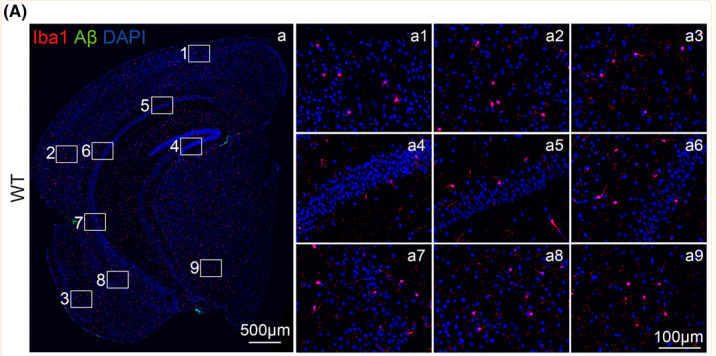
FIGURE 1 The expression of microglia and amyloid‐β (Aβ) plaques in wild‐type (WT) and Alzheimer
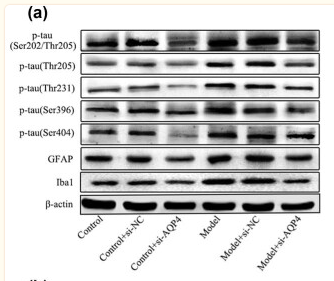
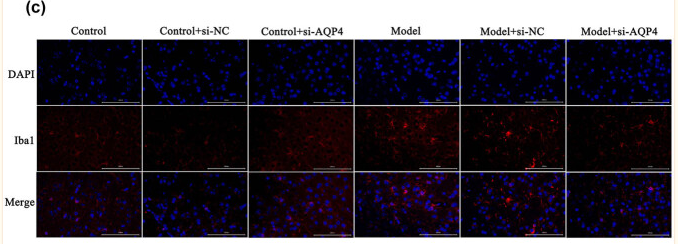
Figure 3 Effects of AQP4 on astrocytes, microglia, and neurodegeneration. (a) The expression of p-tau (Ser202/Thr205, Thr205, Thr231, Ser396, Ser404) and Iba1 in brain tissue was detected by Western blot. (b–e) GFAP, iba1 and GAP43 were detected by Immunofluorescence double staining and analyzed results were obtained (e). *p < 0.05 vs control, # p < 0.05 vs model. All experiments were repeated 3 times. Each group has 7 mice.
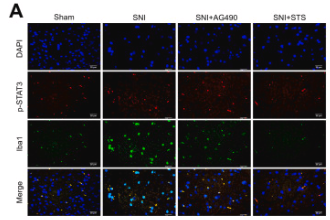
Fig. 6. Effects of STS on the protein expression of STAT3 and p-STAT3 in the ipsilateral dorsal horn of SNI rats and BV-2 cells. (A–B) Immunofluorescence staining showing that p-STAT3 (red) co-localized with microglia (Iba1, green) and astrocytes (GFAP, green); (C–E) Expression levels of STAT3 and p-STAT3 in BV-2 cells were detected by Western blot assay. All data were derived from the results of three independent experiments. Values are mean ± SEM (n = 3 per group), ***P < 0.001, **P < 0.01, *P < 0.05 (one-way ANOVA followed by Tukey
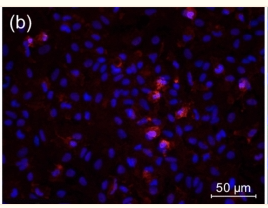
Figure 9 Identification of culture cells: (a) astrocytes in the primary culture: the cell bodies and processes are stained with GFAP antibody (red), the nuclei are stained with DAPI (blue), (b) microglia in the primary culture: cell bodies and processes are stained with Iba1 antibody (red), the nuclei are stained with DAPI (blue), (c) pericytes in the primary culture: the cell bodies and processes are stained with PDGFRB antibody (green), the nuclei are stained with DAPI (blue).
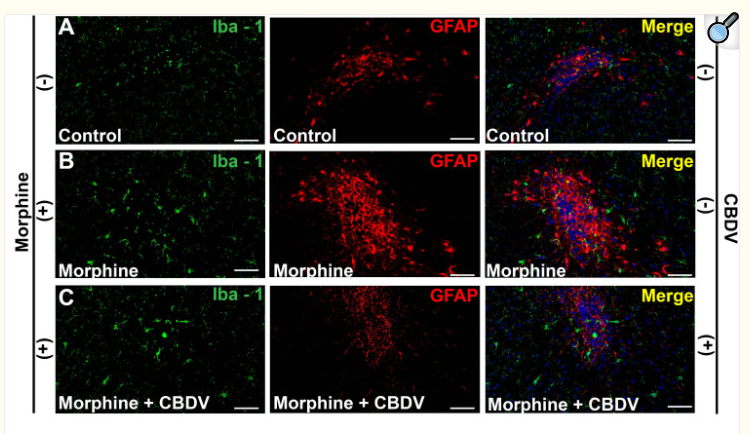
Figure 8. CBDV inhibits chronic morphine treatment-induced glial activation and pro-inflammatory factors IL-6 and TNF-α mRNA expression in NAc. (A–C) Representative double immunofluorescent staining images of Iba1 and GFAP for the control group (A), morphine group (B), and morphine + CBDV group (C). NAc regions were collected following the final behavioral testing shown in Figure 7B . (D, F) The quantification of microglia (D) and astrocytes (F). (E, G) The size of the microglia (E) and astrocytes (G). (H, I) Total RNAs were extracted and qRT-PCR was performed to measure the expression of TNF-α (H) and IL-6 (I) in NAc. Scale bar: 200 μm. All the data represented mean ± S.E.M. ## P < 0.01, ### P < 0.001 versus the control group; *P < 0.05, **P < 0.01, ***P < 0.001 versus the morphine group.

品牌

产品货号

来源种属

Rabbit

抗体克隆

Polyclonal

来源亚型

IgG

实验方法

WB,IHC,IF,ICC

实验种属

Human,Mouse,Rat,Rabbit,Pig,Dog,Chicken,Bovine,Horse,Sheep

偶联标记

Unconjugated

目的蛋白

AIF1/IBA1

产品规格

50μl,100μl,200μl

产品报价

¥1500/¥2750/¥3600

实验应用

Western blotting

Recommended dilution: 1:500-1:2000


Immunofluorescence

Recommended dilution: 1:100-1:500


immunocytochemistry

Recommended dilution: 1:100-1:500


Immunohistochemistry

Recommended dilution: 1:50-1:200


最佳稀释倍数与浓度应由实验研究人员确认

产品说明


产品背景

Actin-binding protein that enhances membrane ruffling and RAC activation. Enhances the actin-bundling activity of LCP1. Binds calcium. Plays a role in RAC signaling and in phagocytosis. May play a role in macrophage activation and function. Promotes the proliferation of vascular smooth muscle cells and of T-lymphocytes. Enhances lymphocyte migration. Plays a role in vascular inflammation.

Description
Rabbit polyclonal antibody to AIF1/IBA1

Applications 
WB, IF, ICC, IHC.

Immunogen 
AIF1/IBA1 Antibody detects endogenous levels of total AIF1/IBA1.

Reactivity 
Human, Mouse, Rat.
可预测:Pig(100%), Bovine(%), Horse(%), Sheep(%), Rabbit(%), Dog(%)

Molecular weight
17kDa; 17kD(Calculated).

Host species 
Rabbit

Ig class 
Immunogen-specific rabbit IgG

Purification 
Antigen affinity purification

Full name 
AIF1/IBA1

Synonyms 
AIF 1; AIF-1; Aif1; AIF1 protein; AIF1_HUMAN; Allograft inflammatory factor 1; Allograft inflammatory factor 1 splice variant G; allograft inflammatory factor-1 splice variant Hara-1; balloon angioplasty responsive transcription; BART 1; G1; G1 putative splice variant of allograft inflamatory factor 1; IBA 1; IBA1; interferon gamma responsive transcript; Interferon responsive transcript 1; interferon responsive transcript factor 1; Ionized calcium binding adapter molecule 1; Ionized calcium-binding adapter molecule 1; ionized calcium-binding adapter molecule; IRT 1; IRT1; Microglia response factor; MRF1; Protein g1;

Storage
Rabbit IgG in phosphate buffered saline , pH 7.4, 150mM NaCl, 0.02% sodium azide and 50% glycerol. Store at -20 °C. Stable for 12 months from date of receipt.

Swissprot 
P55008

产品图片
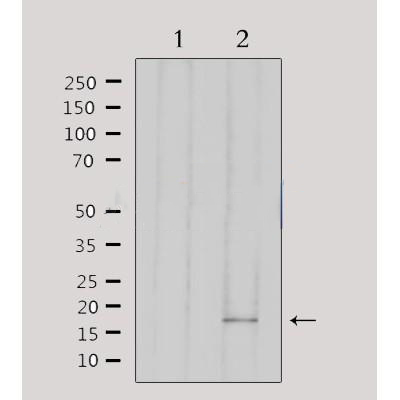
Western blot analysis of extracts from 293, using AIF1 Antibody. Lane 1 was treated with the antigen-specific peptide.

ab16500 at 1/100 staining Rat brain tissue by IHC-P. The sample was formaldehyde fixed and a heat mediated antigen retrieval step in citrate buffer was performed. The sample was then blocked and incubated with the primary antibody at 4°C overnight. An HRP conjugated anti-Rabbit antibody was used as the secondary antibody.

ab16500 at 1/100 staining rat brain tissue by IHC-P. The sample was formaldehyde fixed and a heat mediated antigen retrieval step in citrate buffer was performed. The sample was then blocked and incubated with the antibody for 1.5 hours at 22°C. An HRP conjugated goat anti-rabbit antibody was used as the secondary antibody.

Fig11. |Effects of HT on microglia and astrocyte activation in LPS-challenged mouse brain. C57BL/6 mice were pretreated with HT (100 mg/kg) by gavage daily for 2 days, followed by injection with LPS (10 mg/kg) or PBS. 24 h after LPS or PBS injection, brain section (5 lm thick) were prepared and immunostaining for Iba-1 and GFAP were performed. Representative images of labeling for Iba-1 ((A), hippocampus and cerebral cortex) and GFAP ((C), hippocampus and corpus callosum) are presented, along with quantification results of Iba-1 (B) and GFAP (D).

Fig. 5. |Role of anti-IL-6R, sgp130, and Dexamethasone in activated neurons, astrocytes, and microglia in the dorsal horn of FCA-treated rats vs. controls.G–J: Similar changes were noted in the expression of c-fos, GFAP, and Iba-1 proteins in the spinal cord (P < 0.05). *represents significant changes as compared to the control group. #represents significant changes as compared to the FCA group; bar = 40 μm.

Fig. 5. |Role of anti-IL-6R, sgp130, and Dexamethasone in activated neurons, astrocytes, and microglia in the dorsal horn of FCA-treated rats vs. controls.A–F: The number of activated neurons, astrocytes, and microglia cells expressed by c-fos, GFAP, Iba-1 in the spinal dorsal horn was significantly enhanced in those rats receiving FCA intraplantar injection (P < 0.05), which were significantly decreased with anti-IL-6R, sgp130, and Dexa treatment (P < 0.05).

FIGURE 2 The location and expression of CTRP1 in the brain analyzed by immunofluorescence (n = 3). (A) The expression of CTRP1 in neuron in the cortex, NeuN was used to label neuron. CTRP1 expression was observed by fluorescence microscope and is shown by green fluorescence. NeuN expression is shown by red fluorescence. The nuclei were stained with DAPI and is shown by blue fluorescence. (B) The expression of CTRP1 in astroglia in the cortex. GFAP was used to label astroglia. CTRP1 expression is shown by red fluorescence. GFAP expression is shown by green fluorescence. (C) The expression of CTRP1 in microglia in the cortex. IBA1 was used to label microglia. CTRP1 expression is shown by green fluorescence. IBA1 expression is shown by red fluorescence. (D) The intensity of CTRP1 and NeuN in the cortex. The representative images were acquired under × 400 magnification, scale bars = 50 μm. ****p < 0.0001 vs. sham group.

FIGURE 2 The location and expression of CTRP1 in the brain analyzed by immunofluorescence (n = 3). (A) The expression of CTRP1 in neuron in the cortex, NeuN was used to label neuron. CTRP1 expression was observed by fluorescence microscope and is shown by green fluorescence. NeuN expression is shown by red fluorescence. The nuclei were stained with DAPI and is shown by blue fluorescence. (B) The expression of CTRP1 in astroglia in the cortex. GFAP was used to label astroglia. CTRP1 expression is shown by red fluorescence. GFAP expression is shown by green fluorescence. (C) The expression of CTRP1 in microglia in the cortex. IBA1 was used to label microglia. CTRP1 expression is shown by green fluorescence. IBA1 expression is shown by red fluorescence. (D) The intensity of CTRP1 and NeuN in the cortex. The representative images were acquired under × 400 magnification, scale bars = 50 μm. ****p < 0.0001 vs. sham group.

Fig. 8 Effects of HRS treatment on protein expressions in septic rats 48 h after LPS challenge. A Representative images of protein expression levels by western blot analysis in each group. B–E Statistical representation of relative protein expressions of GFAP, IBA-1, BCL-2 and BAX; respectively. All data are presented as mean ± SD ****p < 0.0001, ***p < 0.001, **p < 0.005, *p < 0.05. HRS Hydrogen-rich saline, LPS Lipopolysaccharide, GFAP Glial fibrillary acidic protein, IBA-1 Ionised calcium binding adaptor molecule 1, BCL-2 B-cell lymphoma 2

Fig. 3. HXP reduced neuroinflammation in MCAO rats by promoting MCPIP1-mediated microglia M2 polarization. A. After reperfusion for 7 d, brain water contents were examined. B. Brain infract volume was detected by 2,3,5-Triphentltetrazolium chloride staining. C. Changes in IL-1β, IL-6, iNOS, and TNF-α were measured via ELISA assy. D. Representative images of histopathological analysis. Scale bar, 20 µm. E. Representative immunofluorescence staining for CD206 (red) and Iba1 (green) in brain tissues. Scale bar, 20 µm. F. The expression of MCPIP1, CD16, iNOS, CD206, Arg1, and PPARγ was detected using Western blotting assay. Data are represented as mean ± standard deviation (N = 5). * * P 

Figure 4 NBP suppressed the activation and regeneration of microglial cells after RCIR. (a) Representative images of double immunofluorescence labeling of Iba-1 (red) and BrdU (green) (200×) in CA1 regions of the hippocampus 4 weeks after RCIR. Iba1+/BrdU+ cells represented microglial proliferation. Bar = 50 μm. Typical double-labeled areas were magnified. n = 4 in each group. (b) The number of Iba-1+/BrdU+ cells in hippocampal CA1 regions. (c, d) Western blot and quantitative analysis of the expressions of Iba-1. n = 6 in each group. β-Actin was used as an internal control. ∗∗∗P < 0.001, the RCIR group vs. sham group; #P < 0.05, ###P < 0.001, the NBP80 group or the NBP120 group vs. the RCIR group; $P < 0.05, the NBP80 group vs. NBP120 group. Values are expressed as the mean ± SD. Iba-1: ionized calcium-binding adapter molecule.

Figure 4 NBP suppressed the activation and regeneration of microglial cells after RCIR. (a) Representative images of double immunofluorescence labeling of Iba-1 (red) and BrdU (green) (200×) in CA1 regions of the hippocampus 4 weeks after RCIR. Iba1+/BrdU+ cells represented microglial proliferation. Bar = 50 μm. Typical double-labeled areas were magnified. n = 4 in each group. (b) The number of Iba-1+/BrdU+ cells in hippocampal CA1 regions. (c, d) Western blot and quantitative analysis of the expressions of Iba-1. n = 6 in each group. β-Actin was used as an internal control. ∗∗∗P < 0.001, the RCIR group vs. sham group; #P < 0.05, ###P < 0.001, the NBP80 group or the NBP120 group vs. the RCIR group; $P < 0.05, the NBP80 group vs. NBP120 group. Values are expressed as the mean ± SD. Iba-1: ionized calcium-binding adapter molecule.

FIGURE 1 The expression of microglia and amyloid‐β (Aβ) plaques in wild‐type (WT) and Alzheimer

Figure 3 Effects of AQP4 on astrocytes, microglia, and neurodegeneration. (a) The expression of p-tau (Ser202/Thr205, Thr205, Thr231, Ser396, Ser404) and Iba1 in brain tissue was detected by Western blot. (b–e) GFAP, iba1 and GAP43 were detected by Immunofluorescence double staining and analyzed results were obtained (e). *p < 0.05 vs control, # p < 0.05 vs model. All experiments were repeated 3 times. Each group has 7 mice.

Figure 3 Effects of AQP4 on astrocytes, microglia, and neurodegeneration. (a) The expression of p-tau (Ser202/Thr205, Thr205, Thr231, Ser396, Ser404) and Iba1 in brain tissue was detected by Western blot. (b–e) GFAP, iba1 and GAP43 were detected by Immunofluorescence double staining and analyzed results were obtained (e). *p < 0.05 vs control, # p < 0.05 vs model. All experiments were repeated 3 times. Each group has 7 mice.

Fig. 6. Effects of STS on the protein expression of STAT3 and p-STAT3 in the ipsilateral dorsal horn of SNI rats and BV-2 cells. (A–B) Immunofluorescence staining showing that p-STAT3 (red) co-localized with microglia (Iba1, green) and astrocytes (GFAP, green); (C–E) Expression levels of STAT3 and p-STAT3 in BV-2 cells were detected by Western blot assay. All data were derived from the results of three independent experiments. Values are mean ± SEM (n = 3 per group), ***P < 0.001, **P < 0.01, *P < 0.05 (one-way ANOVA followed by Tukey

Figure 9 Identification of culture cells: (a) astrocytes in the primary culture: the cell bodies and processes are stained with GFAP antibody (red), the nuclei are stained with DAPI (blue), (b) microglia in the primary culture: cell bodies and processes are stained with Iba1 antibody (red), the nuclei are stained with DAPI (blue), (c) pericytes in the primary culture: the cell bodies and processes are stained with PDGFRB antibody (green), the nuclei are stained with DAPI (blue).

Figure 8. CBDV inhibits chronic morphine treatment-induced glial activation and pro-inflammatory factors IL-6 and TNF-α mRNA expression in NAc. (A–C) Representative double immunofluorescent staining images of Iba1 and GFAP for the control group (A), morphine group (B), and morphine + CBDV group (C). NAc regions were collected following the final behavioral testing shown in Figure 7B . (D, F) The quantification of microglia (D) and astrocytes (F). (E, G) The size of the microglia (E) and astrocytes (G). (H, I) Total RNAs were extracted and qRT-PCR was performed to measure the expression of TNF-α (H) and IL-6 (I) in NAc. Scale bar: 200 μm. All the data represented mean ± S.E.M. ## P < 0.01, ### P < 0.001 versus the control group; *P < 0.05, **P < 0.01, ***P < 0.001 versus the morphine group.

联系经销商
北京晶莱华科生物技术有限公司
北京总部电话:4008-766-085
邮箱:beijing@genlay.cn
地址:北京经济技术开发区科创十三街12号院德为科技园1号楼5层
上海分公司电话:4008-766-085
邮箱:shanghai@genlay.cn
地址:上海市青浦区普仓路648弄71号
长沙分公司电话:4008-766-085
邮箱:changsha@genlay.cn
地址:长沙市岳麓区麓谷大道627号新长海中心A1栋1203室
http://www.genlay.cn
http://www.genecro.cn
genetex@neobioscience.com