ab12667 ACOX1 Antibody

Western blot analysis of extracts from mouse brain, using ACOX1 antibody. Lane 1 was treated with the blocking peptide.
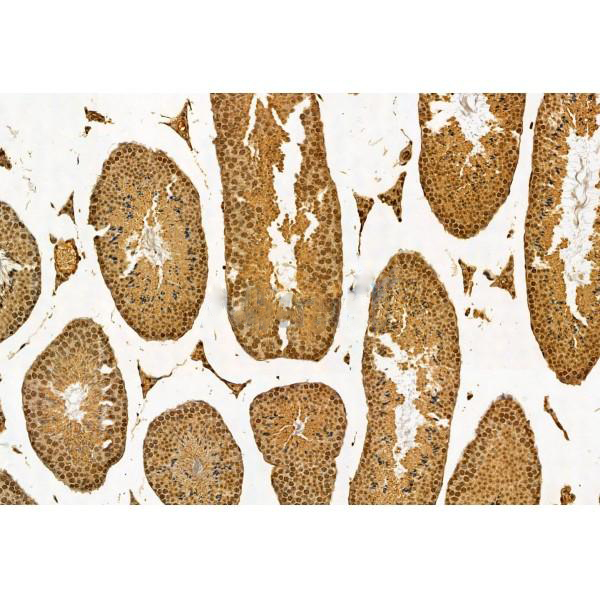
ab12667 at 1/100 staining Mouse testis tissue by IHC-P. The sample was formaldehyde fixed and a heat mediated antigen retrieval step in citrate buffer was performed. The sample was then blocked and incubated with the primary antibody at 4°C overnight. An HRP conjugated anti-Rabbit antibody was used as the secondary antibody.
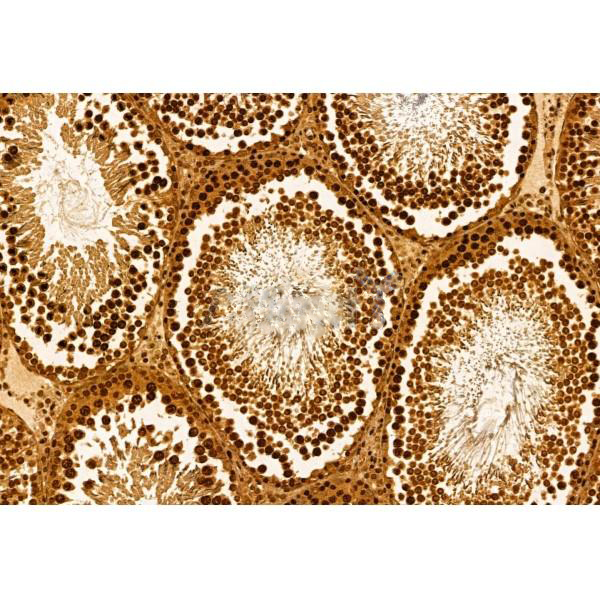
ab12667 at 1/100 staining Rat testis tissue by IHC-P. The sample was formaldehyde fixed and a heat mediated antigen retrieval step in citrate buffer was performed. The sample was then blocked and incubated with the primary antibody at 4°C overnight. An HRP conjugated anti-Rabbit antibody was used as the secondary antibody.
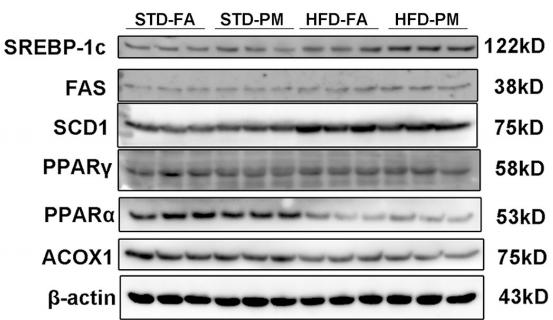
Fig 3. |Ambient PM exposure leads to hepatic steatosis by impairing hepatic lipid metabolism. (A) Oil Red O staining observation of liver (×200, scale bars = 100 μm). (B) H&E staining observation of liver (×200, scale bars = 50 μm). (C) The volume density of quantitation of hepatic steatosis (n = 5). (D) The genes expression involved in fatty acid β-oxidation in liver (n = 5). (E) The mRNA expression of genes involved in lipogenesis and FXR in liver (n = 5). (F) Bands of PPARα,PPARγ, ACOX1, FAS, SREBP-1c, SCD1.
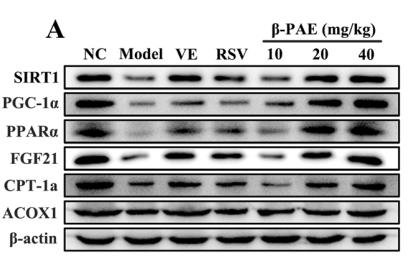
Fig. 6. β-PAE promotes the expression of hepatic lipid oxidation-related proteins and genes in HFD-fed rats. (A–G) Western blot analysis on the expression of SIRT1, PGC-1α, PPARα, FGF21, CPT-1a and ACOX1; (H–K) The mRNA expression of SIRT1, PPARα, CPT-1a and ACOX1. Data are presented as the mean ± SD (n = 6~8). ##p < 0.01 vs. NC group; *p < 0.05, **p < 0.01 vs. Model group.
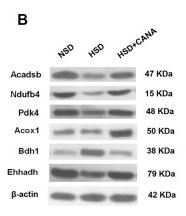
FIGURE 6 Effect of CANA on the cardiac protein expression. (A) Heat map of individual genes within selected pathways, colored by the log2fold change; (B) Selected genes (Acadsb, Ndufb4, Pdk4, Acox1, Bdh1, and Ehhadh) were validated by Western blotting; (C,D) Quantitative evaluation of the protein expression of selected genes (Acadsb, Ndufb4, Pdk4, Acox1, Bdh1, and Ehhadh). * p < 0.05, ** p < 0.01 vs. NSD. # p < 0.05 vs. HSD.
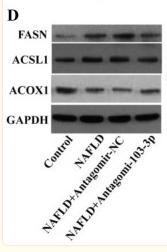
Fig. 3 Antagomir-103-3p alleviated the damage to mice with NAFLD. Mice with NAFLD were fed an HFD for 8 weeks, and Antagomir-NC or Antagomir-103-3p was used for tail vein injection once a week for 2 weeks. A MiR-103-3p expression in mouse liver tissues was examined by qRT-PCR. B Oil Red O staining detected lipid droplet accumulation in mouse liver tissues, and HE staining detected liver tissue lesions in mice. C The TG, ALT, AST and H2O2 contents in mouse serum were examined, while ROS generation and ATP content were examined in mouse tissues. D The protein and mRNA levels of ACOX1, FASN and ACSL1 were examined by western blotting and qRT-PCR, respectively. *P < 0.05 compared with the control group; #P < 0.05 compared with the NAFLD+Antagomir-NC group
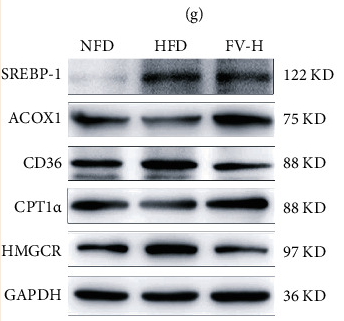
Figure 2 Amelioration of lipid accumulation in PA-induced HepG2 cells by FV. (a) Oil red O was used to measure the level of lipid accumulation (magnification 100x, scale bar = 250 μm). (b) The oil red O-positive area was analyzed and quantified. (c–j) The relative mRNA expression levels of FABP1, SCD1, CD36, HMGCR, ACACA, CCL5, IL-1β, and TNF-α were determined by qRT-PCR. (k) The proinflammatory factor protein levels of IL-1β, IL-6, and TNF-α. (l) The protein levels related to lipid metabolism of SREBP-1, ACOX1, CD36, CPT1α, and HMGCR were analyzed by western blotting, and the relative ratios were calculated and expressed as the mean ± SD; n = 3. #P < 0.05 means that the difference between the NC group and the PA group is significant. ∗P < 0.05 means that the difference between the PA group and the FV (30 mg/mL) group or the FV (15 mg/mL) group is significant.
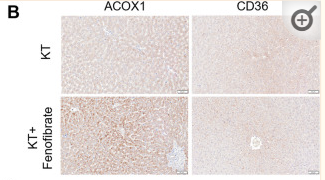
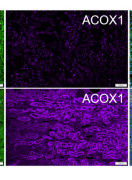
Fig. 2 Fenofibrate treatment attenuated fibrosis in a rat model of renal transplantation. A Schematic view of the treatment of fenofibrate in a rat model of renal transplantation. B Gross morphology of bilateral kidneys from rat underwent kidney transplantation (KT). C IF detected the expression of ACOX1 and α-SMA in transplanted kidney of rats, cell nuclei were strained in blue, renal tubular epithelial cells were stained green, ACOX1 was stained violet, and α-SMA was stained red. Scale bar: 50 μm. D HE, Masson, and Sirius Red staining in transplanted kidney from rat models with or without fenofibrate treatment. Scale bar: 50 μm. E Relative fibrosis level compared fenofibrate treatment group with control group. Significance was determined by Student’s t test.

品牌

产品货号

来源种属

Rabbit

抗体克隆

Polyclonal

来源亚型

IgG

实验方法

WB,IHC

实验种属

Human,Mouse,Rat,Rabbit,Pig,Dog,Chicken,Bovine,Horse,Sheep

偶联标记

Unconjugated

目的蛋白

ACOX1

产品规格

50μl,100μl,200μl

产品报价

¥1500/¥2750/¥3600

实验应用

Western blotting

Recommended dilution: 1:500-1:2000


Immunohistochemistry

Recommended dilution: 1:50-1:200


最佳稀释倍数与浓度应由实验研究人员确认

产品说明


产品背景

Catalyzes the desaturation of acyl-CoAs to 2-trans-enoyl-CoAs. Isoform 1 shows highest activity against medium-chain fatty acyl-CoAs and activity decreases with increasing chain length. Isoform 2 is active against a much broader range of substrates and shows activity towards very long-chain acyl-CoAs. Isoform 2 is twice as active as isoform 1 against 16-hydroxy-palmitoyl-CoA and is 25% more active against 1,16-hexadecanodioyl-CoA.

Description
Rabbit polyclonal antibody to ACOX1

Applications 
WB, IHC.

Immunogen 
ACOX1 Antibody detects endogenous levels of total ACOX1.

Reactivity 
Human, Mouse, Rat.
可预测:Pig(100%), Bovine(100%), Horse(100%), Sheep(100%), Rabbit(100%), Dog(92%)

Molecular weight
50 kDa; 74kD(Calculated).

Host species 
Rabbit

Ig class 
Immunogen-specific rabbit IgG

Purification 
Antigen affinity purification

Full name 
ACOX1

Synonyms 
ACOX; ACOX1; ACOX1_HUMAN; Acyl CoA oxidase 1 palmitoyl; Acyl CoA oxidase straight chain; AOX; EC 1.3.3.6; PALMCOX; Palmitoyl CoA oxidase; Palmitoyl-CoA oxidase; Peroxisomal acyl coenzyme A oxidase 1; Peroxisomal acyl-coenzyme A oxidase 1; Peroxisomal fatty acyl CoA oxidase; SCOX; Straight chain acyl CoA oxidase; Straight-chain acyl-CoA oxidase;

Storage
Rabbit IgG in phosphate buffered saline , pH 7.4, 150mM NaCl, 0.02% sodium azide and 50% glycerol. Store at -20 °C. Stable for 12 months from date of receipt.

Swissprot 
Q15067

产品图片
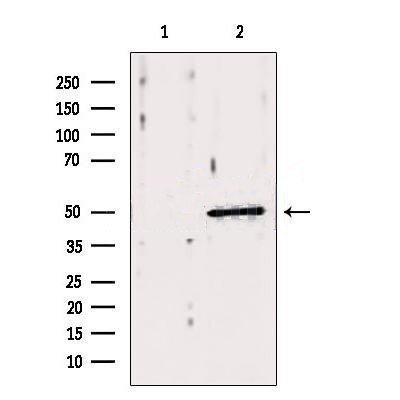
Western blot analysis of extracts from mouse brain, using ACOX1 antibody. Lane 1 was treated with the blocking peptide.

ab12667 at 1/100 staining Mouse testis tissue by IHC-P. The sample was formaldehyde fixed and a heat mediated antigen retrieval step in citrate buffer was performed. The sample was then blocked and incubated with the primary antibody at 4°C overnight. An HRP conjugated anti-Rabbit antibody was used as the secondary antibody.

ab12667 at 1/100 staining Rat testis tissue by IHC-P. The sample was formaldehyde fixed and a heat mediated antigen retrieval step in citrate buffer was performed. The sample was then blocked and incubated with the primary antibody at 4°C overnight. An HRP conjugated anti-Rabbit antibody was used as the secondary antibody.

Fig 3. |Ambient PM exposure leads to hepatic steatosis by impairing hepatic lipid metabolism. (A) Oil Red O staining observation of liver (×200, scale bars = 100 μm). (B) H&E staining observation of liver (×200, scale bars = 50 μm). (C) The volume density of quantitation of hepatic steatosis (n = 5). (D) The genes expression involved in fatty acid β-oxidation in liver (n = 5). (E) The mRNA expression of genes involved in lipogenesis and FXR in liver (n = 5). (F) Bands of PPARα,PPARγ, ACOX1, FAS, SREBP-1c, SCD1.

Fig. 6. β-PAE promotes the expression of hepatic lipid oxidation-related proteins and genes in HFD-fed rats. (A–G) Western blot analysis on the expression of SIRT1, PGC-1α, PPARα, FGF21, CPT-1a and ACOX1; (H–K) The mRNA expression of SIRT1, PPARα, CPT-1a and ACOX1. Data are presented as the mean ± SD (n = 6~8). ##p < 0.01 vs. NC group; *p < 0.05, **p < 0.01 vs. Model group.

FIGURE 6 Effect of CANA on the cardiac protein expression. (A) Heat map of individual genes within selected pathways, colored by the log2fold change; (B) Selected genes (Acadsb, Ndufb4, Pdk4, Acox1, Bdh1, and Ehhadh) were validated by Western blotting; (C,D) Quantitative evaluation of the protein expression of selected genes (Acadsb, Ndufb4, Pdk4, Acox1, Bdh1, and Ehhadh). * p < 0.05, ** p < 0.01 vs. NSD. # p < 0.05 vs. HSD.

Fig. 3 Antagomir-103-3p alleviated the damage to mice with NAFLD. Mice with NAFLD were fed an HFD for 8 weeks, and Antagomir-NC or Antagomir-103-3p was used for tail vein injection once a week for 2 weeks. A MiR-103-3p expression in mouse liver tissues was examined by qRT-PCR. B Oil Red O staining detected lipid droplet accumulation in mouse liver tissues, and HE staining detected liver tissue lesions in mice. C The TG, ALT, AST and H2O2 contents in mouse serum were examined, while ROS generation and ATP content were examined in mouse tissues. D The protein and mRNA levels of ACOX1, FASN and ACSL1 were examined by western blotting and qRT-PCR, respectively. *P < 0.05 compared with the control group; #P < 0.05 compared with the NAFLD+Antagomir-NC group

Figure 2 Amelioration of lipid accumulation in PA-induced HepG2 cells by FV. (a) Oil red O was used to measure the level of lipid accumulation (magnification 100x, scale bar = 250 μm). (b) The oil red O-positive area was analyzed and quantified. (c–j) The relative mRNA expression levels of FABP1, SCD1, CD36, HMGCR, ACACA, CCL5, IL-1β, and TNF-α were determined by qRT-PCR. (k) The proinflammatory factor protein levels of IL-1β, IL-6, and TNF-α. (l) The protein levels related to lipid metabolism of SREBP-1, ACOX1, CD36, CPT1α, and HMGCR were analyzed by western blotting, and the relative ratios were calculated and expressed as the mean ± SD; n = 3. #P < 0.05 means that the difference between the NC group and the PA group is significant. ∗P < 0.05 means that the difference between the PA group and the FV (30 mg/mL) group or the FV (15 mg/mL) group is significant.

Fig. 2 Fenofibrate treatment attenuated fibrosis in a rat model of renal transplantation. A Schematic view of the treatment of fenofibrate in a rat model of renal transplantation. B Gross morphology of bilateral kidneys from rat underwent kidney transplantation (KT). C IF detected the expression of ACOX1 and α-SMA in transplanted kidney of rats, cell nuclei were strained in blue, renal tubular epithelial cells were stained green, ACOX1 was stained violet, and α-SMA was stained red. Scale bar: 50 μm. D HE, Masson, and Sirius Red staining in transplanted kidney from rat models with or without fenofibrate treatment. Scale bar: 50 μm. E Relative fibrosis level compared fenofibrate treatment group with control group. Significance was determined by Student’s t test.

Fig. 2 Fenofibrate treatment attenuated fibrosis in a rat model of renal transplantation. A Schematic view of the treatment of fenofibrate in a rat model of renal transplantation. B Gross morphology of bilateral kidneys from rat underwent kidney transplantation (KT). C IF detected the expression of ACOX1 and α-SMA in transplanted kidney of rats, cell nuclei were strained in blue, renal tubular epithelial cells were stained green, ACOX1 was stained violet, and α-SMA was stained red. Scale bar: 50 μm. D HE, Masson, and Sirius Red staining in transplanted kidney from rat models with or without fenofibrate treatment. Scale bar: 50 μm. E Relative fibrosis level compared fenofibrate treatment group with control group. Significance was determined by Student’s t test.

联系经销商
北京晶莱华科生物技术有限公司
北京总部电话:4008-766-085
邮箱:beijing@genlay.cn
地址:北京经济技术开发区科创十三街12号院德为科技园1号楼5层
上海分公司电话:4008-766-085
邮箱:shanghai@genlay.cn
地址:上海市青浦区普仓路648弄71号
长沙分公司电话:4008-766-085
邮箱:changsha@genlay.cn
地址:长沙市岳麓区麓谷大道627号新长海中心A1栋1203室
http://www.genlay.cn
http://www.genecro.cn
genetex@neobioscience.com