ab12603 alpha SMA Antibody

Western blot analysis of Hela with alpha SMA antibody diluted at 1:5,000.
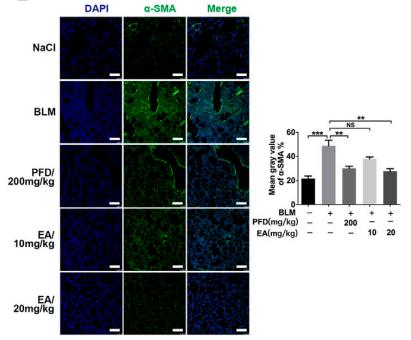
FIGURE 6 Ellagic acid attenuates BLM-induced fibroblasts activation and ECM accumulation in vivo. The mice were treated with Ellagic acid (10 mg/kg, 20 mg/kg) from day 7–13 after administrating BLM (A) Immunohistochemistry was used to analyze the expression levels of α-SMA, Col1 and Fn (n = 3). Quantitative analysis was shown beside. Scale bars: 50 μm (B–C) The expression levels of α-SMA and Col1 were detected by immunofluorescence in lung sections. The analyses of mean gray value were shown beside. Scale bars: 50 μm (D) Lung homogenization was used to analysis the α-SMA, LC3-II/I and p-mTOR , mTOR expression levels by Western blot (n = 6). Densitometric analyses were shown beside. Data in (A,D) are means ± Standard Error of Mean, *p < 0.05, **p < 0.01, ***p < 0.001, and NS: nonsignificant (one-way ANOVA). β-tubulin was used as a loading control.
FIGURE 6 | (B–C) The expression levels of α-SMA and Col1 were detected by immunofluorescence in lung sections. The analyses of mean gray value were shown beside.
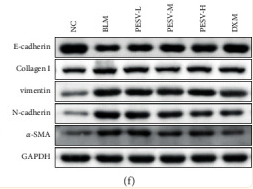
Figure 4 The expression levels of E-cadherin (a), collagen I (b), vimentin (c), N-cadherin (d), and a-SMA (e) protein and their protein band (f) in the lung tissue of mice in each group. NC, normal control group; BLM, bleomycin-induced systemic sclerosis model group; PESV-L, low-dose PESV intervention group; PESV-M, medium-dose PESV intervention group; PESV-H, high-dose PESV intervention group; DXM, dexamethasone intervention group.
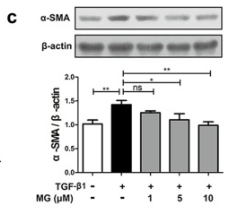
Fig. 1. . Regulation of natural compound mogrol on the EMT in TGF-β1 mediated alveolar epithelial cells MLE-12. Mouse MLE-12 cells were treated with or without TGF-β1 (10 ng/ml) in the absence or presence of mogrol for 48 h. (a) Chemical structure of mogrol. (b) Effects of mogrol (0.1–100 μM) on the proliferation MLE-12 cells were measured by MTT assays. (c-f) Protein expressions of α-SMA, Col I, Vimentin and E-cadherin in MLE-12 cells treated with/without TGF-β1 were detected by western blotting analysis. Data are presented as mean ± SD (n = 5). *p < 0.05, **p < 0.01, ***p < 0.001. NS, non-significant.
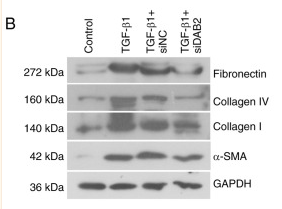
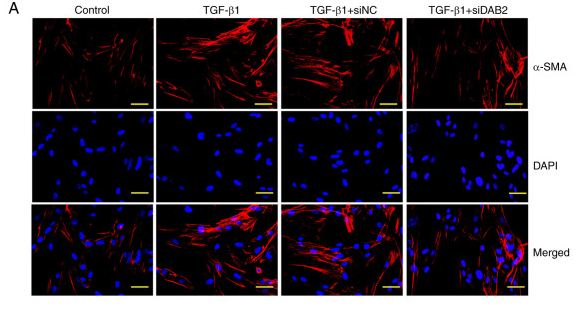
Figure 3 Knockdown of DAB2 inhibited fibrogenesis. (A) Immunofluorescence staining of α-SMA in MRC-5 cells with downregulation of DAB2 following by the treatment of TGF-β1 (scale bar, 50 µm). (B) Protein levels of collagen, collagen Ⅳ, fibronectin and α-SMA in the cells. Data were presented as mean ± SD with three biological repetitions in each group. **P

品牌

产品货号

来源种属

Mouse

抗体克隆

Monoclonal

来源亚型

IgG

实验方法

WB,IF,IP,ELISA,ICC

实验种属

Human,Mouse,Rat,Rabbit,Pig,Dog,Chicken,Bovine,Horse,Sheep

偶联标记

Unconjugated

目的蛋白

alpha SMA

产品规格

50μl,100μl,200μl

产品报价

¥1080/¥1800/¥2400

实验应用


Western blotting

Recommended dilution: 1:1000-10000


Immunofluorescence

Recommended dilution: 1:200


immunocytochemistry

Recommended dilution: 1:200


Immunoprecipitation

Recommended dilution: 1:200


最佳稀释倍数与浓度应由实验研究人员确认

产品说明


产品背景

Actins are highly conserved proteins that are involved in various types of cell motility and are ubiquitously expressed in all eukaryotic cells.

Description
Mouse monoclonal antibody to alpha SMA

Applications 
WB, IF, ICC,  IP, ELISA.

Immunogen 
The α Skeletal Muslce Actin mouse monoclonal antibody can recognize endogenous α Skeletal Muslce Actin proteins.

Reactivity 
Human, Mouse, Rat.

Molecular weight
42kDa; 42kD(Calculated).

Host species 
Mouse

Ig class 
Immunogen-specific rabbit IgG

Purification 
Antigen affinity purification

Full name 
alpha SMA

Synonyms 
a actin; AAT6; ACTA_HUMAN; ACTA2; Actin alpha 2 smooth muscle aorta; Actin aortic smooth muscle; Actin; aortic smooth muscle; ACTSA; ACTVS; Alpha 2 actin; Alpha actin 2; Alpha cardiac actin; Alpha-actin-2; Cell growth inhibiting gene 46 protein; Cell growth-inhibiting gene 46 protein; GIG46; Growth inhibiting gene 46; MYMY5; Sarcomeric Actin;

Storage
1mg/ml in PBS, pH 7.4. Store at -20 °C. Stable for 12 months from date of receipt.

Swissprot 
P62736

产品图片
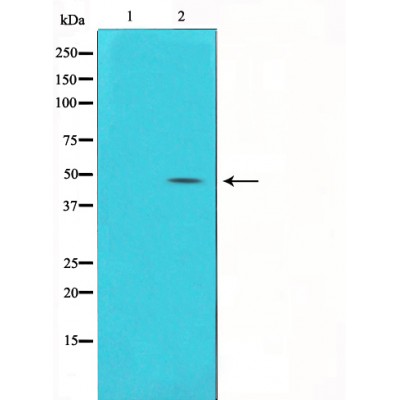
Western blot analysis of Hela with alpha SMA antibody diluted at 1:5,000.

FIGURE 6 Ellagic acid attenuates BLM-induced fibroblasts activation and ECM accumulation in vivo. The mice were treated with Ellagic acid (10 mg/kg, 20 mg/kg) from day 7–13 after administrating BLM (A) Immunohistochemistry was used to analyze the expression levels of α-SMA, Col1 and Fn (n = 3). Quantitative analysis was shown beside. Scale bars: 50 μm (B–C) The expression levels of α-SMA and Col1 were detected by immunofluorescence in lung sections. The analyses of mean gray value were shown beside. Scale bars: 50 μm (D) Lung homogenization was used to analysis the α-SMA, LC3-II/I and p-mTOR , mTOR expression levels by Western blot (n = 6). Densitometric analyses were shown beside. Data in (A,D) are means ± Standard Error of Mean, *p < 0.05, **p < 0.01, ***p < 0.001, and NS: nonsignificant (one-way ANOVA). β-tubulin was used as a loading control.

FIGURE 6 Ellagic acid attenuates BLM-induced fibroblasts activation and ECM accumulation in vivo. The mice were treated with Ellagic acid (10 mg/kg, 20 mg/kg) from day 7–13 after administrating BLM (A) Immunohistochemistry was used to analyze the expression levels of α-SMA, Col1 and Fn (n = 3). Quantitative analysis was shown beside. Scale bars: 50 μm (B–C) The expression levels of α-SMA and Col1 were detected by immunofluorescence in lung sections. The analyses of mean gray value were shown beside. Scale bars: 50 μm (D) Lung homogenization was used to analysis the α-SMA, LC3-II/I and p-mTOR , mTOR expression levels by Western blot (n = 6). Densitometric analyses were shown beside. Data in (A,D) are means ± Standard Error of Mean, *p < 0.05, **p < 0.01, ***p < 0.001, and NS: nonsignificant (one-way ANOVA). β-tubulin was used as a loading control.

FIGURE 6 | (B–C) The expression levels of α-SMA and Col1 were detected by immunofluorescence in lung sections. The analyses of mean gray value were shown beside.

Figure 4 The expression levels of E-cadherin (a), collagen I (b), vimentin (c), N-cadherin (d), and a-SMA (e) protein and their protein band (f) in the lung tissue of mice in each group. NC, normal control group; BLM, bleomycin-induced systemic sclerosis model group; PESV-L, low-dose PESV intervention group; PESV-M, medium-dose PESV intervention group; PESV-H, high-dose PESV intervention group; DXM, dexamethasone intervention group.

Fig. 1. . Regulation of natural compound mogrol on the EMT in TGF-β1 mediated alveolar epithelial cells MLE-12. Mouse MLE-12 cells were treated with or without TGF-β1 (10 ng/ml) in the absence or presence of mogrol for 48 h. (a) Chemical structure of mogrol. (b) Effects of mogrol (0.1–100 μM) on the proliferation MLE-12 cells were measured by MTT assays. (c-f) Protein expressions of α-SMA, Col I, Vimentin and E-cadherin in MLE-12 cells treated with/without TGF-β1 were detected by western blotting analysis. Data are presented as mean ± SD (n = 5). *p < 0.05, **p < 0.01, ***p < 0.001. NS, non-significant.

Figure 3 Knockdown of DAB2 inhibited fibrogenesis. (A) Immunofluorescence staining of α-SMA in MRC-5 cells with downregulation of DAB2 following by the treatment of TGF-β1 (scale bar, 50 µm). (B) Protein levels of collagen, collagen Ⅳ, fibronectin and α-SMA in the cells. Data were presented as mean ± SD with three biological repetitions in each group. **P

Figure 3 Knockdown of DAB2 inhibited fibrogenesis. (A) Immunofluorescence staining of α-SMA in MRC-5 cells with downregulation of DAB2 following by the treatment of TGF-β1 (scale bar, 50 µm). (B) Protein levels of collagen, collagen Ⅳ, fibronectin and α-SMA in the cells. Data were presented as mean ± SD with three biological repetitions in each group. **P

联系经销商
北京晶莱华科生物技术有限公司
北京总部电话:4008-766-085
邮箱:beijing@genlay.cn
地址:北京经济技术开发区科创十三街12号院德为科技园1号楼5层
上海分公司电话:4008-766-085
邮箱:shanghai@genlay.cn
地址:上海市青浦区普仓路648弄71号
长沙分公司电话:4008-766-085
邮箱:changsha@genlay.cn
地址:长沙市岳麓区麓谷大道627号新长海中心A1栋1203室
http://www.genlay.cn
http://www.genecro.cn
genetex@neobioscience.com